Linux processes FAQ: Is there a utility to show Linux processes interactively, like the Unix/Linux ps command, but more like a GUI ro character-based interactive tool?
I was just writing a friend about how to use the Linux ps command, when I thought why bother, what he really needs to see right now is the top command. The Linux top command is an interactive utility that displays a character-based screen of all processes running on the current system. The screen updates itself every few seconds, and you can sort the screen contents by characteristics like CPU Usage or Memory Use.
In this tutorial we'll take a look at the most common uses of the top command, including showing how to sort the output by CPU and memory use, and change the top command display.
The Unix and Linux top command
When you issue the top command like this:
$ top
you'll see a screen that looks something like this:
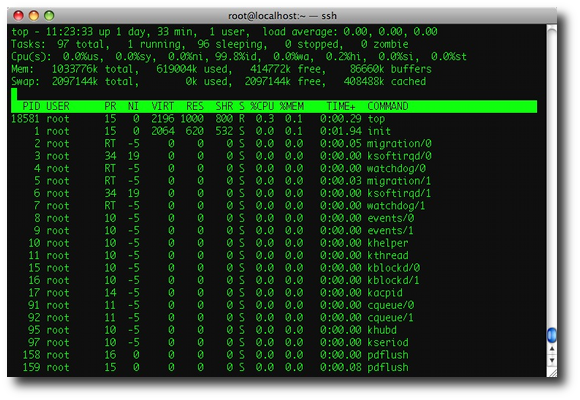
As mentioned, this display will update itself automatically, depending on any settings that you have configured, and the version of the top command you're using.
Linux top command help
To get help on how to use the top command, just press the letter ? or h when the command is running. Doing so will display the following top command help screen:
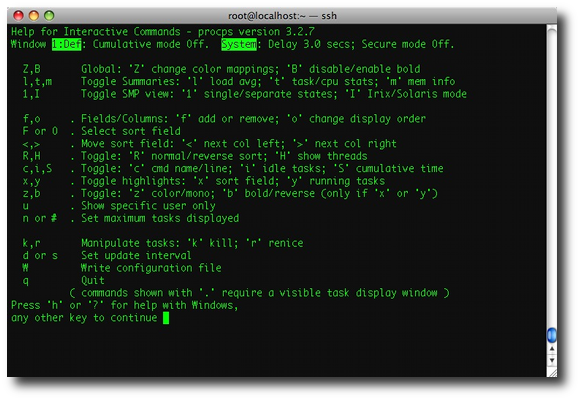
In case I made that image too small, here's the content of this top help screen in text format:
Z,B       Global: 'Z' change color mappings; 'B' disable/enable bold
l,t,m     Toggle Summaries: 'l' load avg; 't' task/cpu stats; 'm' mem info
1,I       Toggle SMP view: '1' single/separate states; 'I' Irix/Solaris mode

f,o     . Fields/Columns: 'f' add or remove; 'o' change display order
F or O  . Select sort field
<,>     . Move sort field: '<' next col left; '>' next col right
R,H     . Toggle: 'R' normal/reverse sort; 'H' show threads
c,i,S   . Toggle: 'c' cmd name/line; 'i' idle tasks; 'S' cumulative time
x,y     . Toggle highlights: 'x' sort field; 'y' running tasks
z,b     . Toggle: 'z' color/mono; 'b' bold/reverse (only if 'x' or 'y')
u       . Show specific user only
n or #  . Set maximum tasks displayed

k,r       Manipulate tasks: 'k' kill; 'r' renice
d or s    Set update interval
W         Write configuration file
q         Quit
        ( commands shown with '.' require a visible task display window )
Press 'h' or '?' for help with Windows,
Sorting the Linux top command display
In my opinion, the most important thing you need to know from this help screen is how to sort the top command display/output. Using the top command that comes with my CentOS Linux system as of September, 2009, you sort the output by first pressing the O key (the uppercase letter 'o'), then choosing a sort column on the following screen.
Here are two quick examples. First, to sort the top command output by memory use, follow these steps:
- Press 'O'
- Press 'N'
- Press [Enter]
Or, to sort the top command display by CPU usage, follow these steps:
- Press 'O'
- Press 'K'
- Press [Enter]
Unix/Linux top command sort options
Here's the text version of the Linux top command sort options screen:
Current Sort Field:  K  for window 1:Def
Select sort field via field letter, type any other key to return

  a: PID        = Process Id                   z: Flags      = Task Flags <sched.h>
  b: PPID       = Parent Process Pid
  c: RUSER      = Real user name             Note1:
  d: UID        = User Id                      If a selected sort field can't be
  e: USER       = User Name                    shown due to screen width or your
  f: GROUP      = Group Name                   field order, the '<' and '>' keys
  g: TTY        = Controlling Tty              will be unavailable until a field
  h: PR         = Priority                     within viewable range is chosen.
  i: NI         = Nice value
  j: P          = Last used cpu (SMP)        Note2:
* K: %CPU       = CPU usage                    Field sorting uses internal values,
  l: TIME       = CPU Time                     not those in column display.  Thus,
  m: TIME+      = CPU Time, hundredths         the TTY & WCHAN fields will violate
  n: %MEM       = Memory usage (RES)           strict ASCII collating sequence.
  o: VIRT       = Virtual Image (kb)           (shame on you if WCHAN is chosen)
  p: SWAP       = Swapped size (kb)
  q: RES        = Resident size (kb)
  r: CODE       = Code size (kb)
  s: DATA       = Data+Stack size (kb)
  t: SHR        = Shared Mem size (kb)
  u: nFLT       = Page Fault count
  v: nDRT       = Dirty Pages count
  w: S          = Process Status
  x: COMMAND    = Command name/line
  y: WCHAN      = Sleeping in Function
As you can see from that output, you can sort the top command output by many different pieces of process information. The asterisk indicates that the output is currently sorted by the %CPU column.
Linux and Unix top command - closing notes
To exit/quit the top command, just type the letter q.
The top command implementation is pretty different on Mac OS X. The top command itself brings up a screen, but the columns are different by default, and the commands you can issue are different. I'm not going to get into all the details for Mac OS X, but just use the ? to get help.
You can control "summary" lines that are displayed on the top lines of the top command display. Use the following one-letter commands to toggle the display of the lines at the top of the display:
- l - load average
- m - memory
- t - task/cpu stats
books by alvin
 |
 |
 |
 |