Table of Contents
- Background
- Definition: What is a Simple Moving Average (SMA)?
- Definition: What is a Exponential Moving Average (EMA)?
- Advantages of moving averages (MA)
- Disadvantages of using moving averages
- Use: Showing trends
- Use: Buying and selling signals (crossovers and trends)
- Use: Support and resistance (ceilings and floors)
- Use: Stock screener
- Moving Average Convergence/Divergence (MACD)
This is a reference page of what I know about “moving averages” in stock market investing. This includes simple moving averages, exponential moving averages, and how to use this data to support buying and selling stocks. I also touch on MACD.
Background
In general, I believe in a Warren Buffett style of investing where you:
- Think about buying a stock as though you are going to buy the entire business
- You base your buying decision on the “value” of the stock
- When you do that, you hold the stock forever
The theory is that from time to time, a stock will fall out of favor with the stock market, and when its price gets to a certain low point, it becomes a “value” to buy. You can think of this strategy as being like buying a new car. If you buy a new car when it’s first introduced, and the model is very popular, the dealer is going to want a lot of money for it. Conversely, if you wait and buy that model 11 months later — when the next “new” model is about to come out — you’ll be able to buy the same car for a much lower price.
I mention this because I’m about to write about moving averages, and moving averages have nothing to do with a Warren Buffett style of investing. Moving averages can be good for people who make a lot of trades, and they can also be used to identify “ceiling” and “floor” prices of stocks. An important idea there is that the “floor price” of a stock using a moving average can be used to set a “stop loss” on a stock.
Because I generally follow the Buffett style of investing I don’t use moving averages as a main tool, but I like to know how they work, and I use them as a way of supporting my other research. Recently I have found that they are nice because I can look at a bunch of output from Finviz or other sites, and see that the “20 Day SMA” for a stock is +2.8%. That tells me at a glance that the stock price is trending up.
Because I don’t use moving averages a lot, this page isn’t completely thorough. Please see the Investopedia pages I link to for much more information. This is just a “reminder” page for me.
Given that background, here’s what I know about moving averages.
Definition: What is a Simple Moving Average (SMA)?
With a few edits by me, Investopedia defines SMA like this: “A simple moving average (SMA) is an arithmetic average that is calculated by adding the closing price of the security for a number of time periods and then dividing this total by the number of time periods. Short-term averages respond quickly to changes in the price of the underlying, while long-term averages are slow to react.”
Later they continue: “In other words, this is the average stock price over a certain period of time. Note that equal weighting is given to each daily price.”
A disadvantage of an SMA is that it gives equal weight to all of the prices used to calculate its value. So in a 20-day SMA, the stock price from 20 days ago has the same weight as the price yesterday. For some purposes it is more useful if the most recent price has a higher weight (more value), and as a result people invented EMAs.
Definition: What is a Exponential Moving Average (EMA)?
This Investopedia page describes EMA like this: “An exponential moving average (EMA) is a type of moving average that is similar to a simple moving average, except that more weight is given to the latest data.”
They later add: “This type of moving average reacts faster to recent price changes than an SMA. The 12- and 26-day EMAs are the most popular short-term averages, and they are used to create indicators like the moving average convergence divergence (MACD) and the percentage price oscillator (PPO).”
EMA advantages compared to SMAs:
- EMAs react quicker to price changes than SMAs.
Advantages of moving averages (MA)
The general advantages of MA values — the reasons they exist — are:
- They filter out the “noise” of stock price fluctuations.
- They show trends. Short-term SMAs (5 to 20 days) show short-term trends, and long-term SMAs (20 to 200 days) show long-term trends.
- A rising MA indicates an uptrend (price increase, or bull).
- A falling MA indicates a downtrend (price decrease, or bear).
- Longer SMAs can show “support” for what the lowest price of a stock should theoretically be, i.e., its “floor.”
- Other tools that I’ll explain soon, including crossovers, ceilings, and floors.
Disadvantages of using moving averages
Before getting into how to use moving averages to buy and sell stocks, it’s important to know that they have some disadvantages:
- They are based only on historial data (trends). They are not really predictive.
- They are only good with strong trends that are going up or down. They are not useful when a stock price is going sideways.
- You can get “false positives,” especially when looking at shorter time frames.
These statements will make more sense as I explain how traders use moving averages.
Use: Showing trends
Moving averages can be used to show trends. Their value in this regard is that they smooth out the “noise” when a stock is a little volatile.
Use: Buying and selling signals (crossovers and trends)
Price crossover
Some investors use moving averages to look for buying and selling signals. In the simplest form, when a daily stock price moves above or below a moving average, this is called a “price crossover,” and it can indicate a buy/sell signal:
- When the stock price moves below a moving average, it can indicate a time to sell.
- When the stock price moves above a moving average, it can indicate a time to buy.
When multiple moving averages cross over
Another signal is when a short-term moving average crosses over a long-term moving average:
- When the shorter MA crosses above the longer MA, this is a buy signal, and is labeled as a “golden cross.”
- When the shorter MA crosses below the longer MA, this is a sell signal, and is labeled a “death cross.”
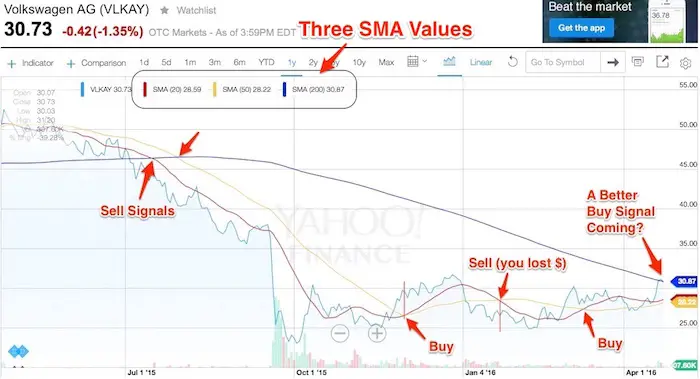
Three SMA signals
This example from Yahoo Finance for Volkswagen shows three SMA signals, and how their crossovers might be used to buy and sell VLKAY. Note that I usually use a red color to show the shortest time frame (it’s “hot”), a yellow color for the medium-term time frame, and a blue color for the longest time period (it’s “cool”):
SMA signal vs EMA signal
This second example shows what an SMA-20 looks like compared to an EMA-20 for VLKAY:

As I mentioned, I don’t really buy stocks this way, so I’m not an expert on what time period is “best.” For example, it may be better to use a short EMA (20 days) against a longer SMA (50 days).
Uptrends
- A stock is considered to be in an uptrend when (a) the current price is above a moving average, and (b) the average is sloping upward.
Use: Support and resistance (ceilings and floors)
This Investopedia page provides these definitions of support and resistance in regards to moving averages:
- Support is established when a price is trending downward. There is a point at which the selling pressure subsides and buyers are willing to step in. In other words, a “floor” is established.
- Resistance happens when a price is trending upward. There comes a point when the buying strength diminishes and the sellers step in. This is a “ceiling.”
The theory is that stocks will usually “bounce” off of the floor or ceiling, but it’s important to know that this isn’t always the case. The 200-day SMA seems to be used commonly as a ceiling and floor.
Use: Stock screener
Over the last few months I have used moving averages as a “stock” with the Barchart.com website. This image shows how Barchart shows VLKAY right now (April 24, 2016):

As you can see, Barchart shows a variety of stock signals on one page.
Personally, I don’t buy or sell anything by looking at this one page, but I do use it as a signal, or a screener. Volkswagen is on my radar because they were found to be cheaters on their emissions tests last summer/fall, which tanked their stock. So my current interests are:
- Will the stock price come back?
- If so, is it coming back now?
These signals give me a hint in regards to that second question.
Moving Average Convergence/Divergence (MACD)
Quick summary
I don’t use MACD very often, and I’m not an expert on using it, but here are some quick notes:
- When MACD is positive, the short term average is above the long term average. This indicates upward price momentum (price is increasing).
- A negative value indicates current momentum is downward.
- A move above zero can indicate a buy, and a move below zero can indicate a sell.
MACD can also be used with a signal line, but I have not used that yet.
MACD details
MACD is more complicated than using simple moving averages, but once you understand it, it helps to show trends better/faster than moving averages alone. (I am not a MACD expert yet, as I generally do not make trades based on these theories; I just use them to support my other research.)
This Investopedia page defines MACD like this: “MACD is a trend-following momentum indicator that shows the relationship between two moving averages of prices. The MACD is (usually) calculated by subtracting the 26-day exponential moving average (EMA) from the 12-day EMA.”
This Investopedia page describes it a little better: “The concept behind the MACD is fairly straightforward. Essentially, it calculates the difference between an instrument's 26-day and 12-day exponential moving averages (EMA). Of the two moving averages that make up the MACD, the 12-day EMA is obviously the faster one, while the 26-day is slower.”
They continue on that page: “On the MACD chart, a nine-day EMA of the MACD itself is plotted as well, and it acts as a trigger for buy and sell decisions. The MACD generates a bullish signal when it moves above its own nine-day EMA, and it sends a sell sign when it moves below its nine-day EMA.”
You really need to look at charts to understand MACD, so I suggest looking at those two links.
More notes from the first link:
- Crossovers - When the MACD falls below the signal line, it is a bearish signal, indicating that it may be time to sell. Conversely, when the MACD rises above the signal line, the indicator gives a bullish signal, which suggests that the price of the asset is likely to experience upward momentum. Many traders wait for a confirmed cross above the signal line before entering into a position to avoid getting getting “faked out” or entering into a position too early, as shown by the first arrow.
- Divergence - When the security price diverges from the MACD. It signals the end of the current trend.
- Dramatic rise - When the MACD rises dramatically - that is, the shorter moving average pulls away from the longer-term moving average - it is a signal that the security is overbought and will soon return to normal levels.
From this excellent Investopedia page:
- The popularity of the MACD is largely due to its ability to help quickly spot increasing short-term momentum.
- Many traders will watch for a short-term moving average to cross above a longer-term moving average and use this to signal increasing upward momentum. This bullish crossover suggests that the price has recently been rising at a faster rate than it has in the past, so it is a common technical buy sign.
- (Looking at the graph on that link) Notice how the moving averages diverge away from each other in Figure 1 as the strength of the momentum increases. The MACD was designed to profit from this divergence by analyzing the difference between the two exponential moving averages. Specifically, the value for the long-term moving average is subtracted from the short-term average, and the result is plotted onto a chart. (Equation for each day = EMA12 - EMA26)
- A positive MACD value, created when the short-term average is above the longer-term average, is used to signal increasing upward momentum. This value can suggest that traders may want to refrain from taking short positions until a signal suggests it is appropriate. On the other hand, falling negative MACD values suggest that the downtrend is getting stronger, and that it may not be the best time to buy.
- It has become standard to plot a separate moving average alongside the MACD, which is used to create a clear signal of shifting momentum.
MACD advantages
- Signals are easily interpreted
- Can be incorporated into any short-term trading strategy
- Helps traders ensure that short-term direction is working in their favor
MACD disadvantages
- False-positives, what that Investopedia page calls a “whipsaw effect”
books by alvin
 |
 |
 |
 |
