By Alvin Alexander. Last updated: June 14, 2016
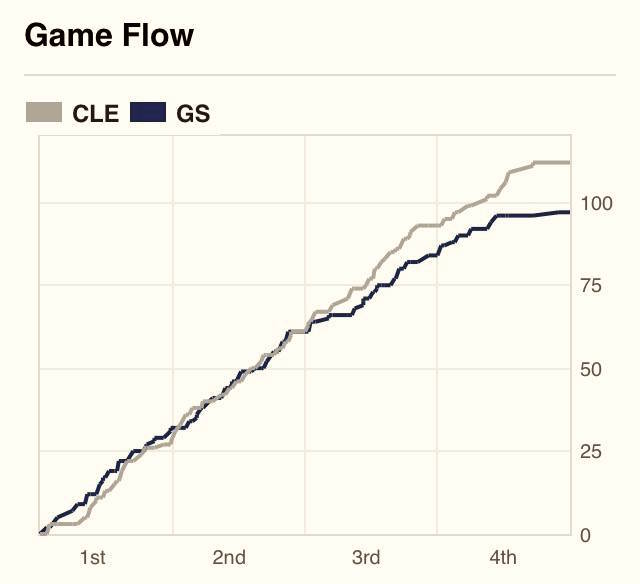
I like this chart/infographic from espn.com that shows the “game flow” for Game 5 of the 2016 NBA Finals. Without watching the game you can get a feel for the ebb and flow of the game, and how it got away from Golden State.
It reminds me of trying to get a software project live, where the developers are knocking out tasks and bugs (and if the project isn’t in control, other forces are trying to add new tasks, which I always compared to moving the finish line in a race).
Photo D8