Table of Contents
- Installing gnuplot
- gnuplot: Sample data files
- Starting gnuplot
- Simple plotting
- Titles, labels, legend, arrows
- Multiple curves on one plot
- Multiple graphs (multiplot)
- ASCII plotting
- Plotting formulas
- Grid, tickmarks, axis ranges, log
- Comment and column-separator characters
- Run shell commands
- Session management
- Real-world example
- Resources
- Gnuplot Help
I needed to use Gnuplot a little bit over the last few days, mostly to create 2D line charts, and these are my brief notes on how to get started with Gnuplot. If you haven’t used it before, it’s an amazing tool for creating graphs and charts.
Jumping right in ...
Installing gnuplot
To get started, you can use MacPorts or Homebrew to install Gnuplot on macOS systems:
port install gnuplot
brew install gnuplot
Note that with Mac OS X Yosemite (10.10.x) running on an old Mac, I had to use this brew command instead:
brew install gnuplot --with-qt
You’ll know that you need that command if you get this error message when you try to run a plot command inside the gnuplot command line:
WARNING: Plotting with an 'unknown' terminal.
No output will be generated. Please select a terminal with 'set terminal'.
You can find more information about the need for this new brew command at this SO link.
gnuplot: Sample data files
The examples below use the following 2-column and 4-column data files:
# sample 2-column data file
# -------------------------
1     1
2     4
3     9
4    16
5    25
6    36
7    49
8    64
9    81
10  100
My four-column file is named 4col.csv:
1,    1,   2,   5
2,    4,   4,  10
3,    9,   6,  15
4,   16,   8,  20
5,   25,  10,  25
6,   36,  12,  30
7,   49,  14,  35
8,   64,  16,  40
9,   81,  18,  45
10, 100,  20,  50
Note that the columns in the first file are separated by whitespace, and the columns in the second file are separated by commas (a CSV file). The latest version of Gnuplot works with both formats without requiring you to specify a column-separator.
Starting gnuplot
Start Gnuplot from your Mac Terminal:
$ gnuplot

gnuplot>
It prompts you with gnuplot> as shown, but I won’t show that prompt in the examples below.
Simple plotting
Plotting the data from a two-column file is easy:
plot '2col.dat'
This creates the following graph:
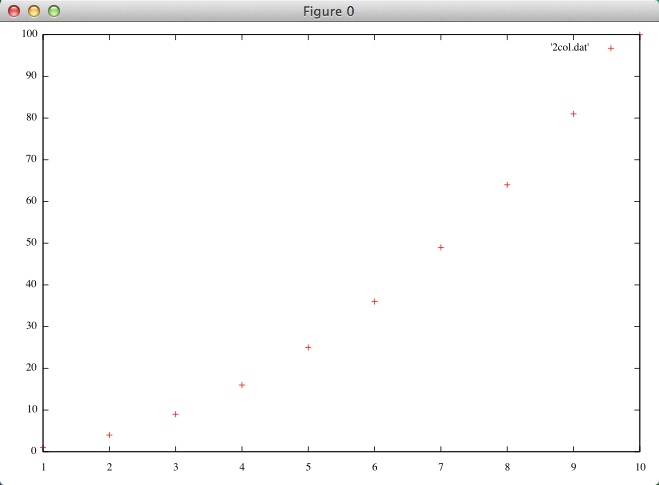
Key points about this basic command:
- Assumes col1=x, col2=y; shows ’+’ at data points
- Does not connect points with a line
- Opens plot in an ’AquaTerm’ on Mac OS X
From here you can do all sorts of fun things:
# simple plotting
plot '2col.dat'                                # assumes col1=x, col2=y; shows '+' at data points
plot '2col.dat' with lines                     # connect points with a line
plot '2col.dat' with linespoints               # line and points
plot '2col.dat' with points                    # just points (default)

# plot a subset of the data
plot[1:5] '2col.dat' with linespoints          # plot the first 5 elements
plot[3:7] '2col.dat' with linespoints          # plot only elements 3 thru 7

# add a title to your line
plot '2col.dat' with lines title 'my curve'    # this is really the line-title in the legend

# map the columns to the x- and y-axes
plot '2col.dat' using 1:2                      # 1=x, 2=y (this is the default)
plot '2col.dat' using 2:1                      # 2=x, 1=y (reverse the graph)

# abbreviations
plot '2col.csv' u 1:2 w l title 'Squared'      # 'u' - using, 'w l' - with lines
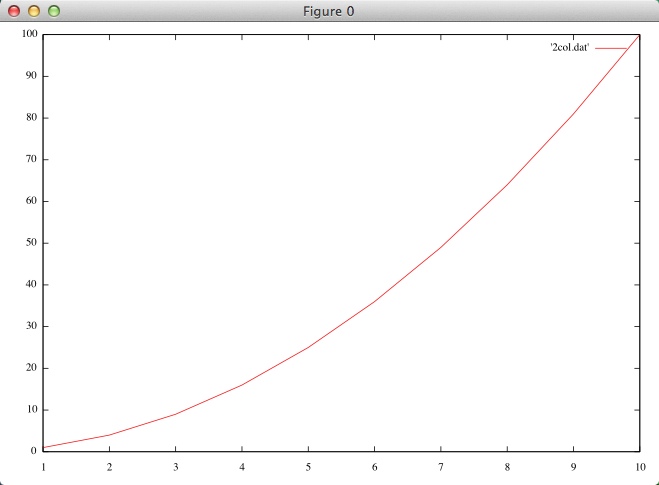
This command
plot '2col.dat' with lines
creates this plot:
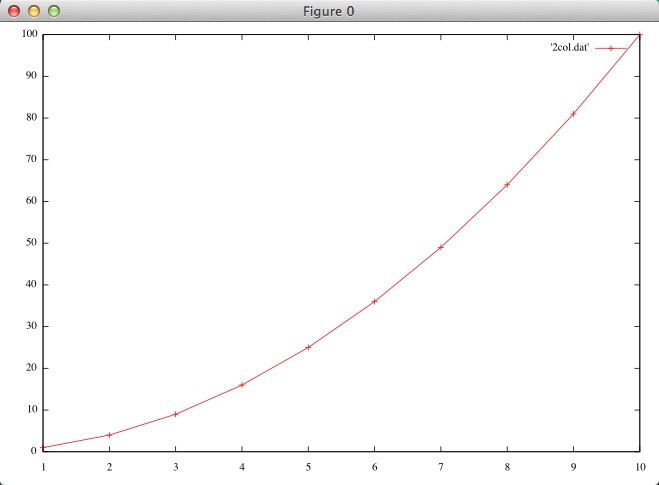
And this command:
plot '2col.dat' with linespoints
creates this plot:
Titles, labels, legend, arrows
You can adorn your plots with titles, labels, legend, arrows, and more:
set title 'Hello, world'                       # plot title
set xlabel 'Time'                              # x-axis label
set ylabel 'Distance'                          # y-axis label

# labels
set label "boiling point" at 10, 212

# key/legend
set key top right
set key box
set key left bottom
set key bmargin
set key 0.01,100

set nokey     # no key

# arrow
set arrow from 1,1 to 5,10
Multiple curves on one plot
To show multiple curves on one plot, use the 4col.csv file:
1,    1,   2,   5
2,    4,   4,  10
3,    9,   6,  15
4,   16,   8,  20
5,   25,  10,  25
6,   36,  12,  30
7,   49,  14,  35
8,   64,  16,  40
9,   81,  18,  45
10, 100,  20,  50
One curve using first two columns:
plot '4col.csv' with lines
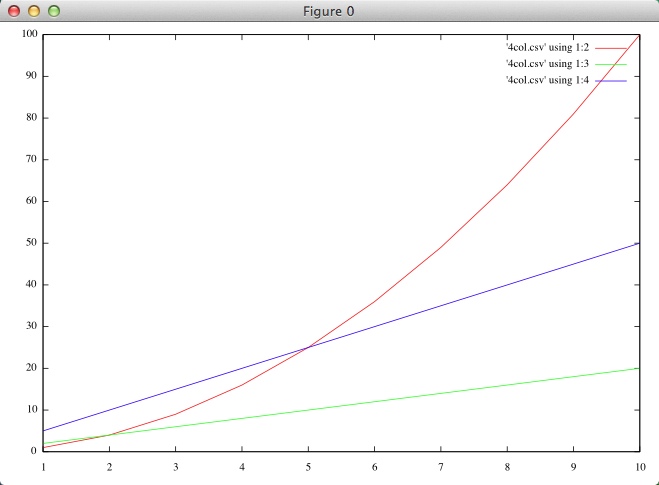
Multiple curves:
plot '4col.csv' using 1:2 with lines, '4col.csv' using 1:3 with lines
plot '4col.csv' using 1:2 with lines, '4col.csv' using 1:3 with lines, '4col.csv' using 1:4 with lines
The second command shown creates this chart:
Add a legend:
plot '4col.csv' using 1:2 with lines title 'Square', '4col.csv' using 1:3 with lines title 'Double'
Use abbreviations:
plot '4col.csv' u 1:2 w l title 'Square', '4col.csv' u 1:3 w l title 'Double'
Multiple formulas:
plot sin(x) title 'Sine Function', tan(x) title 'Tangent'
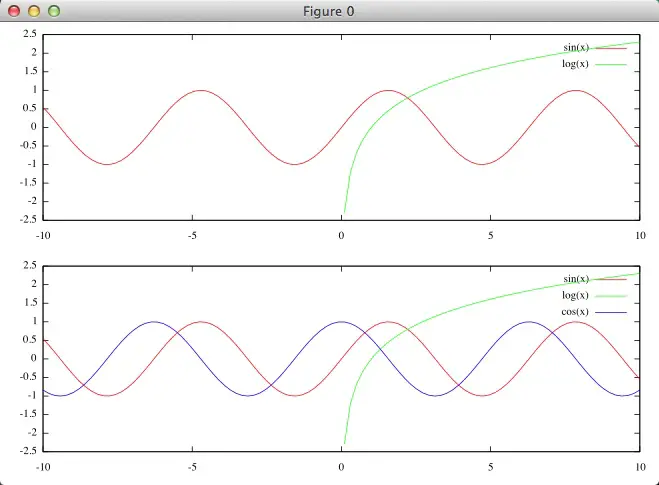
Multiple graphs (multiplot)
How to show multiple graphs in the output:
set multiplot                       # multiplot mode (prompt changes to 'multiplot')
set size 1, 0.5

set origin 0.0,0.5
plot sin(x), log(x)

set origin 0.0,0.0
plot sin(x), log(x), cos(x)

unset multiplot                     # exit multiplot mode (prompt changes back to 'gnuplot')
That series of commands creates this chart:
ASCII plotting
You can create ASCII plots in your Mac Terminal window:
set terminal dumb
plot cos(x)
plot sin(x) w lines cos(x) w lines
Plotting formulas
It’s fun and easy to plot formulas with Gnuplot:
plot sin(x)
plot sin(x)/x

plot cos(x)
plot cos(x)/x

plot sin(x) title 'Sin', tan(x) title 'Tangent'
Plot your own formulas:
f(x) = sin(x) + tan(x)
plot f(x) with points
plot f(x) with filledcurves
plot f(x) with filledcurves above x1
Grid, tickmarks, axis ranges, log
It can be nice to have a grid on a chart, and it can also be nice to control the graph tickmarks, ranges, and origin:
# grid
set grid

# ranges
set autoscale                          # let gnuplot determine ranges (default)
set xrange [1:10]
set yrange [1:100]
set xr [0.0:10.0]
set yr [0:5]

# tickmarks

set xtics (1, 5, 10)
set ytics (1, 25, 50, 75, 100)
set xtic auto                          # set xtics automatically
set ytic auto                          # set ytics automatically
unset xtics

set ytics 400
set ytics (0,200,400,600,800,1000,1200)
set y2tics (-100,0,100)
set mytics 4
set mxtics 5

set xzeroaxis lt -1
set x2zeroaxis lt -1

# logarithmic scale
set logscale
set logscale y
Comment and column-separator characters
Set gnuplot file comment character(s):
set datafile commentschars "//"
Set gnuplot file column separator:
# see http://gnuplot.sourceforge.net/docs_4.2/node173.html

set datafile separator "\t"
set datafile separator ","
set datafile separator "|"

set datafile separator {"<char>" | whitespace}
Run shell commands
You can run shell commands from the Gnuplot command line:
# run shell command
!cat 2col.dat
Session management
When you work from the Gnuplot command line, you’re working in a session:
reset     # reset everything
replot    # re-plot your data after making changes
Un-set the key/legend and re-plot:
unset key
replot
Real-world example
Here’s a quick real-world example. I had this dataset of my blood pressure and heart rate from yesterday:
# time, sys, dia, hr
8.5, 112, 60, 52
9, 116, 73, 59
10.5, 127, 71, 58
11, 124, 69, 62
11.5, 117, 68, 60
12, 122, 73, 60
13, 121, 67, 62
15, 120, 78, 68
15.5, 134, 70, 96
16, 120, 72, 73
16.5, 114, 68, 72
22, 119, 69, 61
I then used this sequence of commands (including some trial and error that’s not shown):
set grid
set title 'BP and Heartrate'
set yrange [50:160]
set xlabel 'time (military)'
set label 'finished walk' at 15, 140
unset label
set label 'finished walk' at 15, 105
plot 'bp-hr.dat' u 1:2 w lp t 'systolic', 'bp-hr.dat' u 1:3 w lp t 'diastolic', 'bp-hr.dat' u 1:4 w lp t 'heartrate'
to create this graph of my blood pressure and heart rate:
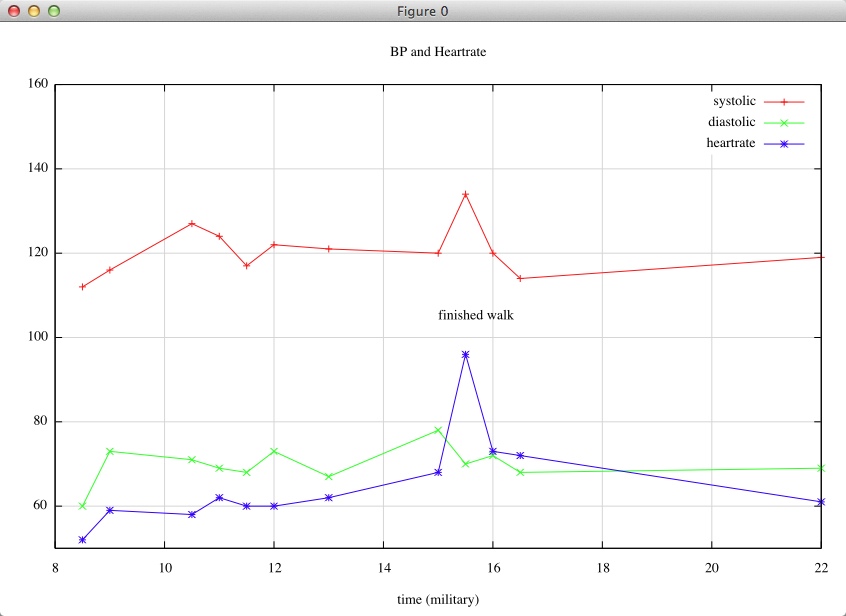
It would be better to put the blood pressure on the y-axis on the left, and the heart rate on the y-axis on the right, but I’m short on time, and haven’t learned how to do that yet.
Resources
I mostly learned about Gnuplot from the following resources:
- gnuplot.sourceforge.net/demo/
- http://www.cs.hmc.edu/~vrable/gnuplot/using-gnuplot.html
- http://research.physics.illinois.edu/ElectronicStructure/498-s97/comp_info/gnuplot.html
- http://people.duke.edu/~hpgavin/gnuplot.html
- http://gnuplot-tricks.blogspot.com/
- http://lowrank.net/gnuplot/datafile-e.html
- http://www.helsinki.fi/~jalaaman/gnuplot/index.html
Gnuplot Help
Help commands:
help
help terminal
Other notes:
- Don’t type a blank space after the line continuation character, ”\"
- Your data may be in multiple data files
More to come ...
books by alvin
 |
 |
 |
 |