Table of Contents
In addition to Yahoo Finance and Seeking Alpha — my usual haunts — the following stock/investing websites look interesting, and may have the kind of visual information I’m looking for.
2023 updates
These are some updated links from my work in 2023.
Insider buying:
Stock screeners:
- Barchart
- Finviz
- Morningstar (is good for “moat” references)
- Simply Wall Street has good charts/graphics
- Zacks
buyupside.com
These are the best links I’ve found so far:
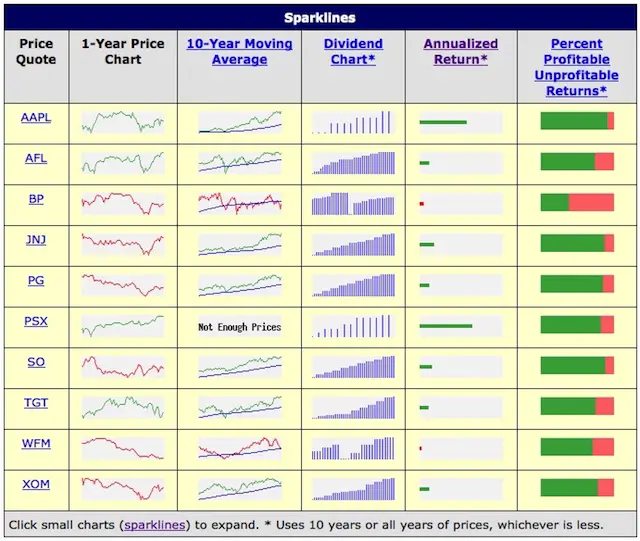
I found a PDF that says they have over 450K unique monthly visitors, 1.2M past and present customers, and 42.5M monthly page views.
This is what their list of sparklines for 10 stocks looks like:
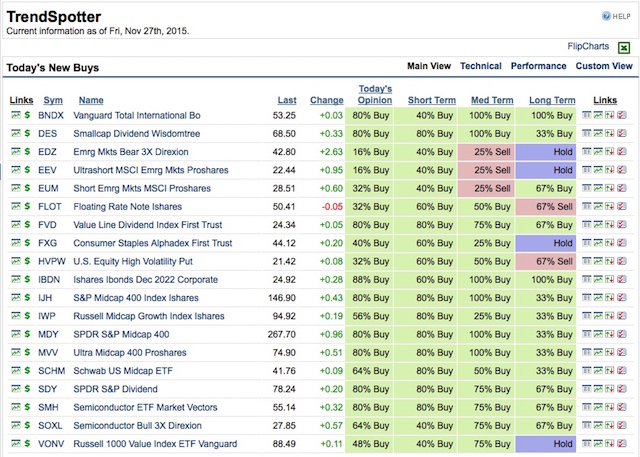
barchart.com
Best links I’ve found so far:
This is a sample of what their data looks like (you need to set up a free account to see some of these things):
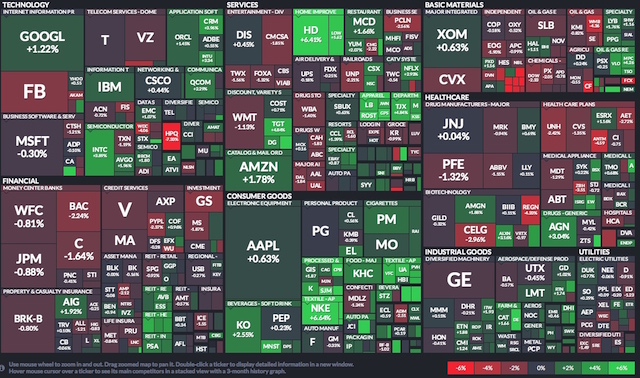
finviz.com
Best links I’ve found so far:
This is what one of their maps looks like:
Non-visual resources
Other good non-visual resources:
- David Fish DRiP list
- David Fish Dividend Aristocrats
- Capital One Investing (formerly Sharebuilder) has some good screeners
What I want
I made a few notes last night of what I really want right now, and that list includes:
- In general I want visual push notifications that can then be followed up with good data. That’s why I like the idea of sparklines.
- I want new ideas of things to invest in.
- I want to a simple way to keep an eye on current investments (push, not pull).
- I need to have some sort of quarterly goals, such as dividend income, or something else.
- Example: Right now I want to keep an eye on W.W. Grainger, Exxon, and Ford.
I do use Google alerts on companies/stocks I’m interested in, and I want more push information like that. If some resource could push me the sparklines I want on a daily basis, I’d pay for that.
books by alvin
 |
 |
 |
 |