|
To begin counting the transactional functions we first need to look at the user interface screens in the application. Let's look at all of these screens first, then determine which of these are EI's, which are EO's, and finally which are EQ's.
Screen shots from the application
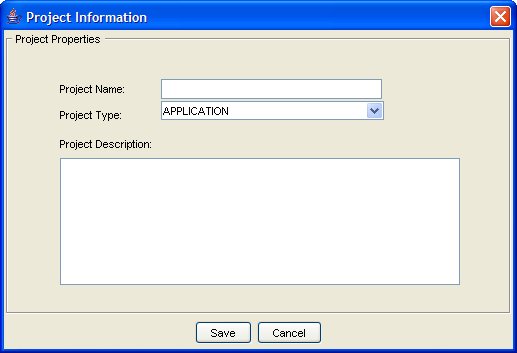
Figure 2: The "New Project" screen lets users create a new project.
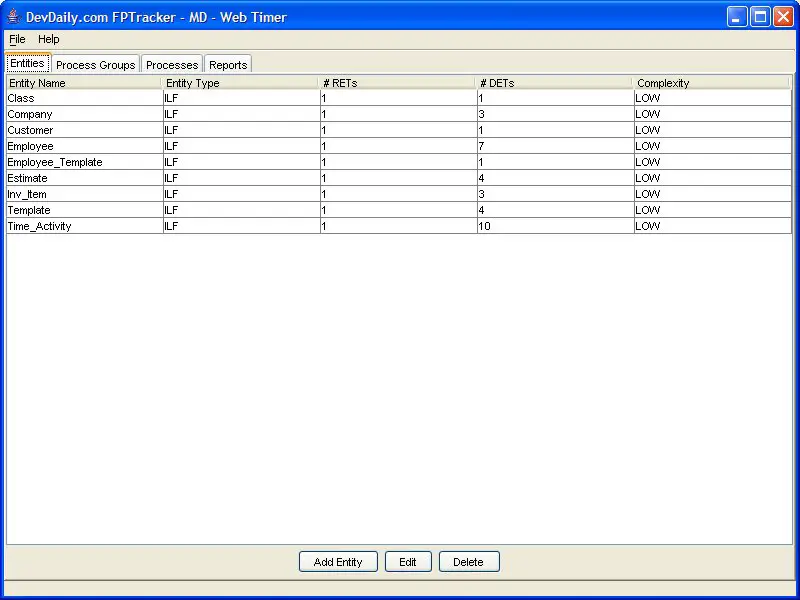
Figure 3: This screen shows the Entities tab. From this location users can View, Add, Edit, and Delete entities.
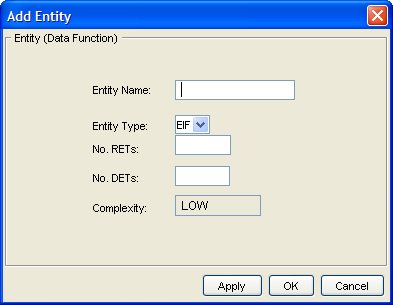
Figure 4: The "Add Entity" screen lets the user add new entities (ILFs and EIFs) to the project.
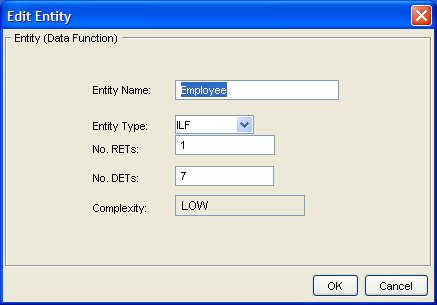
Figure 5: The "Edit Entity" screen lets the user edit entities in the project.
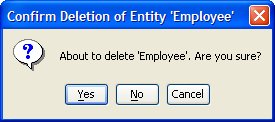
Figure 6: The "Delete Entity" screen asks the users to confirm their attempt to delete an entity in the application.
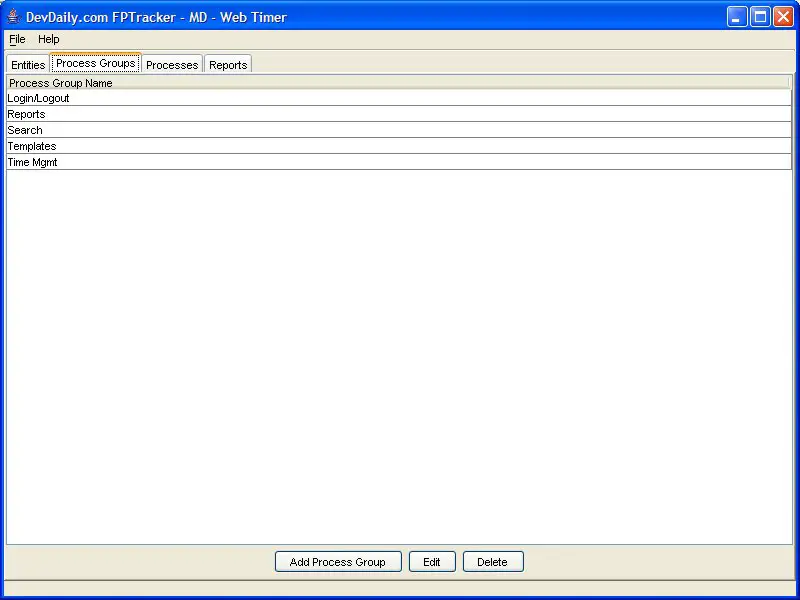
Figure 7: This screen shows the Process Groups tab. From this screen users can Add, Edit, and Delete Process Groups.
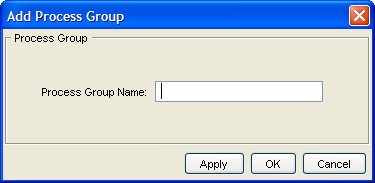
Figure 8: The "Add Process Group" screen lets the user add new process groups to the application.
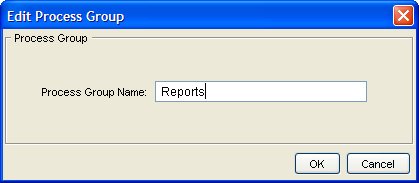
Figure 9: The "Edit Process Group" lets the user assign a new name to a process group.
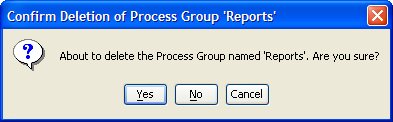
Figure 10: This screen lets the user delete a selected process group.
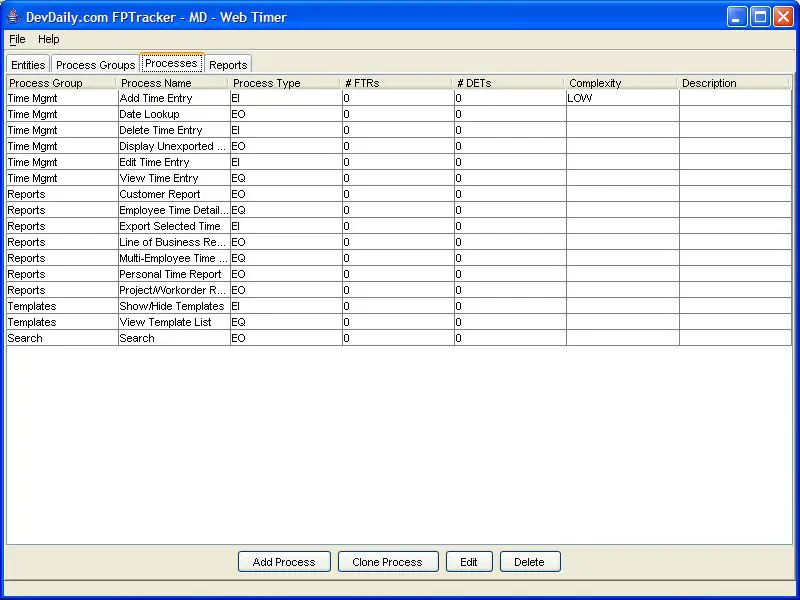
Figure 11: This figure shows the Processes tab. From this location users can Add, Clone, Edit, and Delete processes.
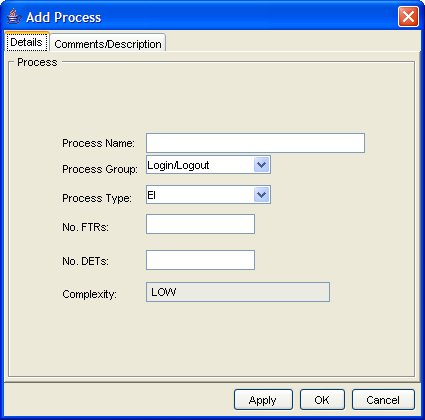
Figure 12: This screen lets the user define a new process. Note the "Description" tab. Those details are shown in the
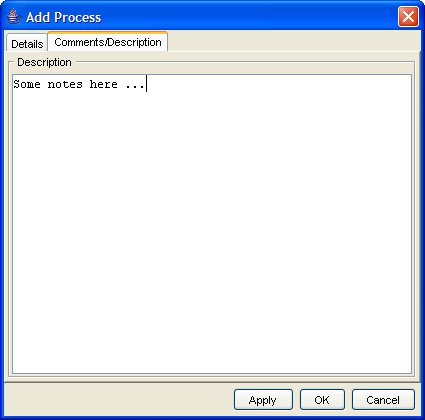
Figure 13: This screen shows the details of the Comments/Description tab. Users can optionally enter information here when creating a new Process.
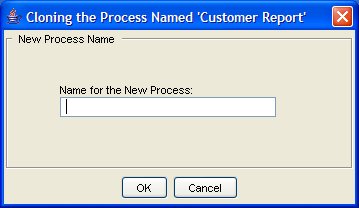
Figure 14: Users can use this screen to clone a Process in the application. They simply select an existing Process, then select a Clone option that leads to this screen.
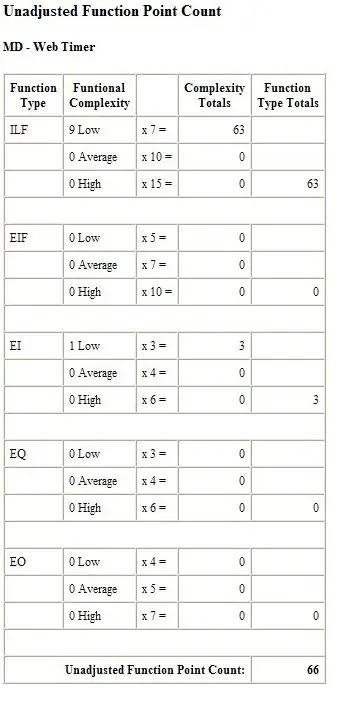
Figure 15: This screen shows a basic Unadjusted Function Point Count report.
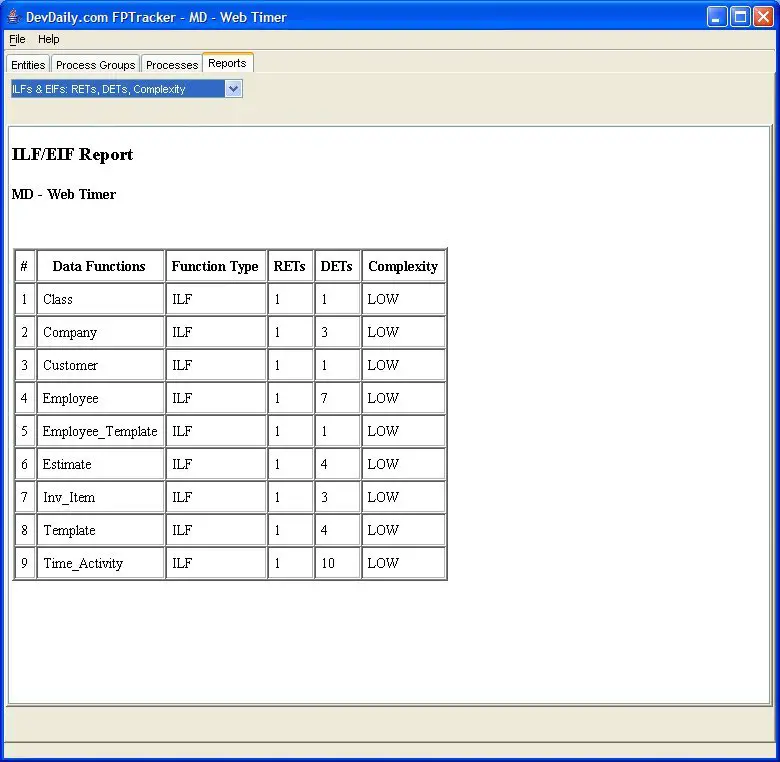
Figure 16: This figure shows a report provided by the application called the "ILF/EIF Report".
Now that we've seen the screens in the application we have to determine which of these correspond to EI's, which are EO's, and which are EQ's. We'll do that in the next sections.
Brief process descriptions
Because you haven't seen this application before, it may be hard to understand the processes in this application. Therefore, I'll provide a brief name and description of each process in this application.
| Process Name |
Process Description |
| Create a Project |
This screen is displayed in Figure 2. This lets the user create a new project. Note that for the purposes of this paper I am skipping other project-related processes, including the ability to list, edit, delete, and clone projects. |
| Display Entity List |
The list is displayed in Figure 3. This is a list of every Entity that the user has identified for the application they are counting. |
| Add Entity |
Shown in Figure 4, this dialog lets the user add a new Entity. |
| Edit Entity |
Shown in Figure 5, this dialog lets the user edit an existing Entity. This dialog appears when the user highlights a row in the Entity List, then selects the Edit button. Alternatively, they can double-click on the desired row. |
| Delete Entity |
Shown in Figure 6, this confirmation dialog is displayed when a user selects a row, then presses the Delete button. |
| Display Process Group List |
This list is shown in Figure 7. This is a list of every Process Group the user has identified. |
| Add Process Group |
Shown in Figure 8, this dialog lets the user define a new Process Group. |
| Edit Process Group |
Shown in Figure 9, this dialog lets the user edit an existing Process Group. |
| Delete Process Group |
Shown in Figure 10, this confirmation dialog is displayed when a user selects a row in the Process Group table, then presses the Delete button. |
| Display Process List |
The list is displayed in Figure 11. This is a list of every Process that the user has identified for the application they are counting. |
| Add Process |
Shown in Figures 12 and 13, this dialog lets the user define a new Process. |
| Edit Process |
Although not shown, this dialog is identical to screens shown in Figures 12 and 13, other than the title of the dialog. These screens let the user edit an existing Process. |
| Delete Process |
Although not shown, this confirmation dialog is displayed when a user selects a row, then presses the Delete button. For the sake of our count, assume that it is a simple confirmation dialog, similar to the dialog for deleting a Process Group. |
| Clone Process |
Shown in Figure 14, this dialog lets the user make a duplicate copy of a Process. This makes it easy to create new processes which are very similar to an existing process. |
| Display UFPC Report |
Shown in Figure 15, this is a typical report that totals up the number of FPs in the application you are recording. The report is displayed after the user selects the report type from a drop-down list of reports in the Reports tab. The list of data shown in the drop-down list is hard-coded into the application. |
| Display ILF/EIF Report |
Shown in Figure 16, this report shows the ILFs and EIFs (i.e., all the FTRs) in the application, along with their associated number of DETs and RETs, as well as their complexity level. It is selected from the same drop-down list as the UFPC Report. |
Table 20: Processes in the FPTracker application
There is a little more to this application than what is shown in these figures, but for the purposes of this paper, these screens and descriptions define the application under consideration.
For our counting purposes, we will also assume that each data-entry screen can also result in one or more error screens. For example, when a user is creating a new project, the system will display an error dialog if they do not provide a project name, because this is a required field.
In the next section we'll classify each of these processes as an EI, EO, or EQ, and determine the FPs associated with each process.
Function points resulting from EI's
The table below lists the External Inputs in the application. It also lists the number of DETs and FTRs for each process, and the complexity that results from the number of DETs and FTRs.
| Process |
# DETs |
FTR Names |
# FTRs |
Resulting Complexity |
# FPs |
|---|
| Create Project |
5 |
Project |
1 |
Low |
3 |
| Add Entity |
7 |
Project, Entity |
2 |
Average |
4 |
| Edit Entity |
7 |
Project, Entity |
2 |
Average |
4 |
| Delete Entity |
4 |
Project, Entity |
2 |
Low |
3 |
| Add Process Group |
3 |
Project, ProcessGroup |
2 |
Low |
3 |
| Edit Process Group |
3 |
Project, ProcessGroup |
2 |
Low |
3 |
| Delete Process Group |
4 |
Project, ProcessGroup |
2 |
Low |
3 |
| Add Process |
9 |
Project, Process, ProcessGroup |
3 |
High |
6 |
| Edit Process |
9 |
Project, Process, ProcessGroup |
3 |
High |
6 |
| Delete Process |
5 |
Project, Process, ProcessGroup |
3 |
High |
6 |
| Clone Process |
3 |
Project, Process, ProcessGroup |
3 |
Average |
4 |
| |
|
|
|
Total: |
45 |
Table 21: External Inputs (EI's) in the FPTracker application
|
|


