The Mac OS X Activity Monitor is a cool utility. As shown in the following figure, the main screen shows all the processes running on your system, the user that owns the process, the percent of CPU it's using, the virtual memory it's using, and more. My most common thing here is to sort by memory or CPU use to get a general idea of what's going on.
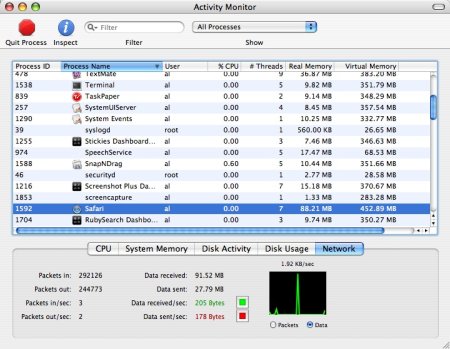
On this main screen you can also get general system information on CPU, memory, disk activity, disk usage, and network stats from the tabs on the bottom panel of the screen.
Mac Activity Monitor - Individual Mac processes
Beyond this, the Activity Monitor gets even cooler when you look at an individual process, because then you can see more detail information about the process/application, including detailed memory use, kernel-related statistics, and open files and ports. You can open a detailed window by double-clicking a row, or selecting a row and then clicking the Inspect icon. This window is shown in the next figure.
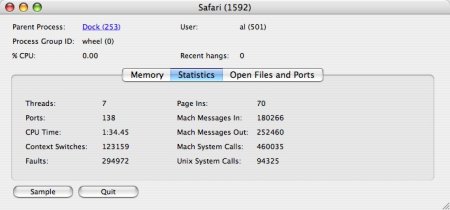
Finally, if you'd like to geek out a little, you can even go deeper and "sample" the application to see the current call graph by pressing the Sample button.
You can find the Activity Monitor by opening the Applications folder, and then opening the Utilities sub-folder.
books by alvin
 |
 |
 |
 |