By Alvin Alexander. Last updated: June 4, 2016
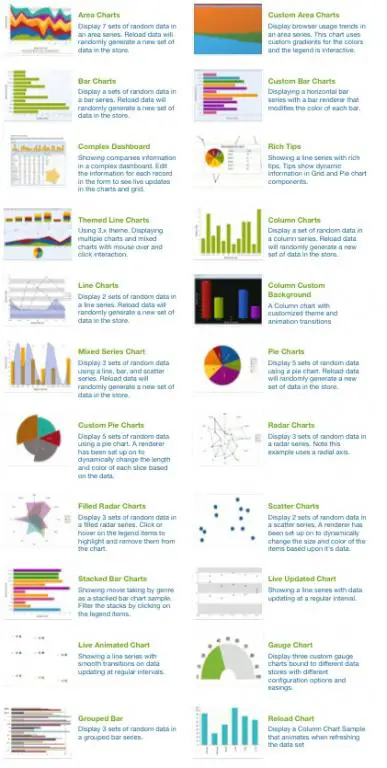
I still have a hard time finding what I want on the Sencha website, so I’m trying to add links here to make their documentation and examples easier for me to find. Here are two examples of the charts and graphs that they offer. This first set of Sencha chart examples comes from this link:
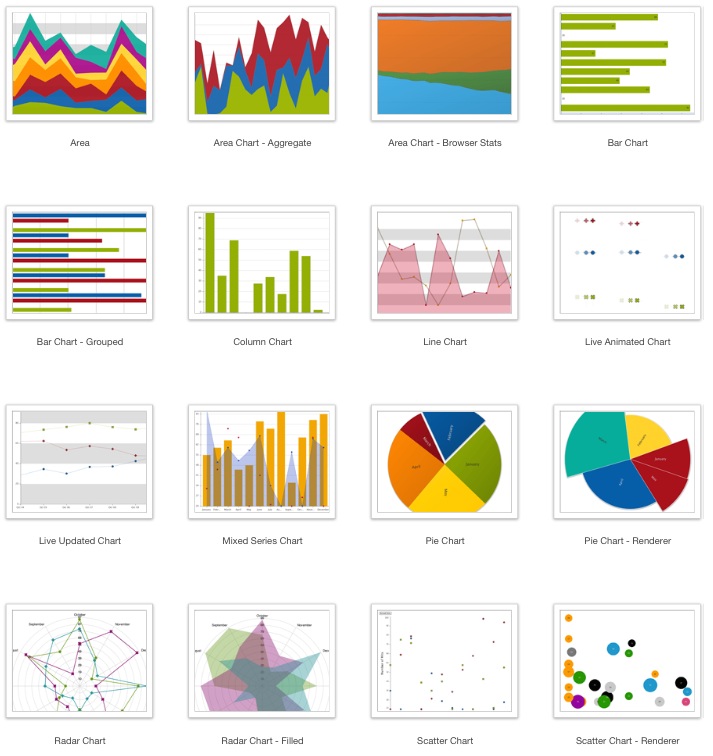
This second set of chart and graph examples comes from this link:
If you click through those links, and then click on the images on the Sencha website, they do share their code, which is very helpful.
books by alvin
 |
 |
 |
 |