By Alvin Alexander. Last updated: June 28, 2019
Here’s an example of how to create an X/Y graph in Scala using JFreeChart and Scala Swing. It’s worth mentioning that the “neurosky” reference has to do with Neurosky MindWave headset, and the JFreeChart libraries are under the org.jfree package:
package com.alvinalexander.neurosky

import org.jfree.chart.{ChartFactory, ChartPanel}
import org.jfree.data.category.DefaultCategoryDataset
import org.jfree.chart.plot.PlotOrientation
import scala.swing._
import java.awt.BorderLayout

object LineChartExample extends SimpleSwingApplication {

    val ATTENTION = "Attention"
    val MEDITATION = "Meditation"

    val data = new DefaultCategoryDataset
    data.addValue(100.0, ATTENTION, 1)
    data.addValue(200.0, ATTENTION, 2)
    data.addValue(300.0, ATTENTION, 3)
    data.addValue(400.0, ATTENTION, 4)
    data.addValue(500.0, ATTENTION, 5)

    data.addValue(500.0, MEDITATION, 1)
    data.addValue(400.0, MEDITATION, 2)
    data.addValue(300.0, MEDITATION, 3)
    data.addValue(200.0, MEDITATION, 4)
    data.addValue(100.0, MEDITATION, 5)

    val chart = ChartFactory.createLineChart(
        "Brainwaves", "Time", "Value",
        data, PlotOrientation.VERTICAL,
        true, true, true)

    def top = new MainFrame {
        title = "Brainwave Plotter"
        peer.setContentPane(new ChartPanel(chart))
        peer.setLocationRelativeTo(null)
    }

}
That code results in this chart:
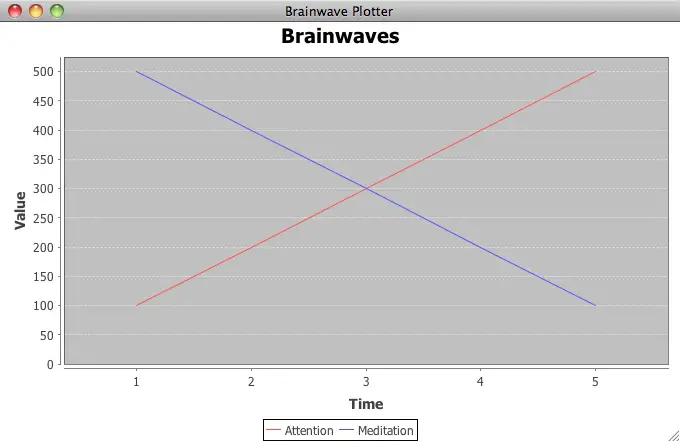
Of course you need the proper libraries and all that good stuff, but that shows how easy it is to write the code to create a graph with these tools. I hope to be using code like this to chart my brainwaves soon, and thought I’d share this code while I’m trying to get to my destination.
Reporting live from Boulder, Colorado,
Al
books by alvin
 |
 |
 |
 |