Summary: A look at the performance improvements gained on a Drupal 6 website by using the PHP APC Opcode Cache.
Wow, I just installed the PHP APC Opcode Cache module on alvinalexander.com, and the results are really incredible. By any metric the website is performing much, much faster.
I ran two benchmarks on the website using the Apache 'ab' benchmarking tool, one without the APC opcode cache, and one with it.
First, here is the ab output running my Drupal 6 website without the APC opcode cache:
# ab results without apc cache
Concurrency Level:      5
Time taken for tests:   14.830242 seconds
Complete requests:      1000
Failed requests:        0
Write errors:           0
Total transferred:      27367000 bytes
HTML transferred:       26895000 bytes
Requests per second:    67.43 [#/sec] (mean)
Time per request:       74.151 [ms] (mean)
Time per request:       14.830 [ms] (mean, across all concurrent requests)
Transfer rate:          1802.06 [Kbytes/sec] received

Connection Times (ms)
              min  mean[+/-sd] median   max
Connect:        0    1   6.1      0      43
Processing:    23   71  51.3     61     661
Waiting:        0   65  48.5     56     625
Total:         23   73  51.5     62     661

Percentage of the requests served within a certain time (ms)
  50%     62
  66%     75
  75%     81
  80%     89
  90%    111
  95%    149
  98%    224
  99%    251
 100%    661 (longest request)
Next, here are the Apache ab benchmark results I get when the APC opcode cache is running:
# ab benchmark results with apc opcode cache
Concurrency Level:      5
Time taken for tests:   4.226672 seconds
Complete requests:      1000
Failed requests:        0
Write errors:           0
Total transferred:      27367000 bytes
HTML transferred:       26895000 bytes
Requests per second:    236.59 [#/sec] (mean)
Time per request:       21.133 [ms] (mean)
Time per request:       4.227 [ms] (mean, across all concurrent requests)
Transfer rate:          6322.94 [Kbytes/sec] received

Connection Times (ms)
              min  mean[+/-sd] median   max
Connect:        0    0   0.1      0       3
Processing:     7   20   8.4     19      97
Waiting:        6   19   8.3     18      96
Total:          7   20   8.4     19      97

Percentage of the requests served within a certain time (ms)
  50%     19
  66%     22
  75%     24
  80%     25
  90%     30
  95%     36
  98%     44
  99%     49
 100%     97 (longest request)
I ran both of these Apache ab commands as shown here, when the web server was under its lightest normal load:
ab -n 1000 -c 5 http://localhost/
This ab commands runs 1,000 page requests, using five simultaneous threads.
Drupal APC performance numbers
As you can see, the Drupal APC cache performance numbers are striking:
| Without APC | With APC | |
| Time taken for tests: | 14.8 secs | 4.2 secs |
| Requests per second: | 67.4 | 236.6 |
| Time per request: | 74.1 ms | 21.1 ms |
All of those numbers art stunning. Just looking at the total time taken for the tests, it was reduced from 14.8 seconds to 4.2 seconds, a whopping reduction of 71.6%.
Drupal APC cache hit rate
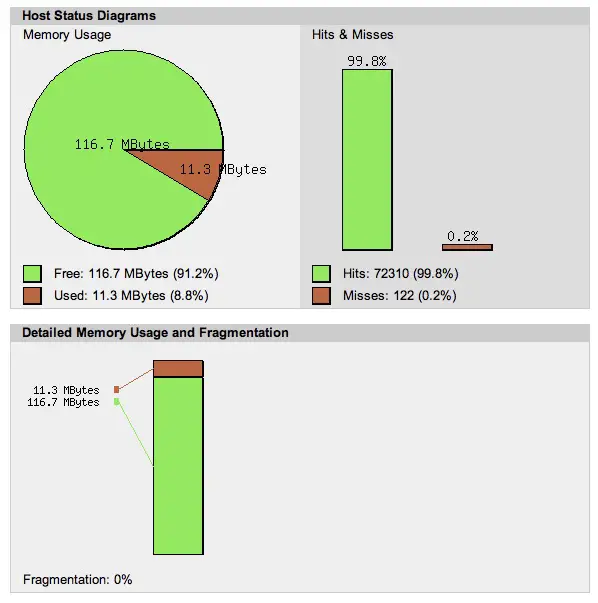
As a quick update, here's what the APC cache hit rate looks like on my Drupal website. This image was taken after allowing the cache to run for a little while:

As you can see, the cache is getting a 99.8% hit rate, and it also looks like I won't need anywhere near the 128MB I initially allocated for the cache.
Drupal APC Opcode Cache performance - Summary
I'll write more about the experience of installing the APC Opcode Cache on my Drupal 6 website as time permits, but for now, I just wanted to share these numbers. I'm also using several Google tools to measure web page loading performance, and in a few days I should have numbers from them, and I'll share those here as well.


