Component #2: The software monitoring program
The second piece of the self-healing architecture is to have a program that monitors your worker programs. You can write your own software monitoring program, as I did many years ago, but that's pretty old-school, and frankly, not a good idea any more.
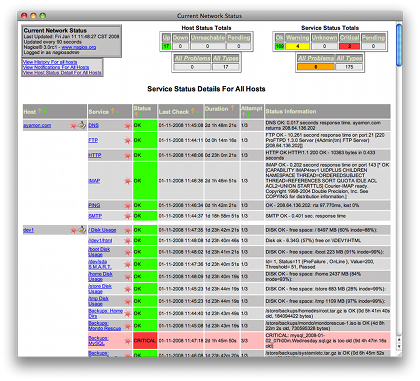
These days there is an open source project named Nagios that does everything my old monitoring application did, and much more. In short, Nagios can monitor your applications, servers, and network. And it provides a user interface to show the current status of every component it monitors, a notification component to notify the right people when something goes wrong, and even a scheduler so you can deal with scheduled downtime and holidays.
Here's a screenshot of one of the many Nagios monitoring screens available in their user interface (courtesy of nagios.org):

So, in regards to a monitoring program, my recommendation here is easy: download, install, and learn how to use Nagios to monitor your worker programs, and your entire network.
Note: I keep saying "network" because some times it appears that your worker programs have failed, but what has really happened is that a network resource has failed, i.e., a database server, a file server, a router, or something else. The failure of any network component that supports your worker can make it look like your program failed, when in fact it was something else. And believe me, nothing is more powerful to support your claims than having a Project Sponsor look at a Nagios screen, and see that a supporting component has failed. Very quickly they realize what's really going on.
Monitoring your application with a Nagios agent
Beyond doing all these wonderful things, Nagios also supports a very simple interface that feeds directly into my monitoring plans. I'll write about this more in a future tutorial, but in short, it's very easy to write a Nagios agent that (a) knows how to talk to your worker, and (b) can be plugged into Nagios. In fact, you can write an agent in many different languages, including very simple shell scripts.
The only thing your Nagios agent really has to do is:
- Know how to call your worker application's
status()method. - Get the return information from the
status()method. - Provide one of the following return codes to Nagios:
- '0' - everything is okay.
- '1' - warning; the service was checked, but the information it returned indicated it was at or above a warning threshold.
- '2' - critical; the plugin detected that either the service was not running or it was above some "critical" threshold.
- '3' - uknown; a major failure occurred trying to contact the worker program.
Again, I'll try to cover all of this in more detail in a future tutorial, as it's too long to write here, but to summarize the monitoring solution:
- Install Nagios.
- Write a very simple Nagios agent that knows how to call the
status()method of your worker program. - Configure Nagios to use that agent to track the status of your worker.
What's next
In the next (and final) part of my self healing recipe, you can also configure Nagios to send a "repair" command to your worker program when it detects a failure.
(Or, if you prefer, you can go back to Part 1 of this series.)


